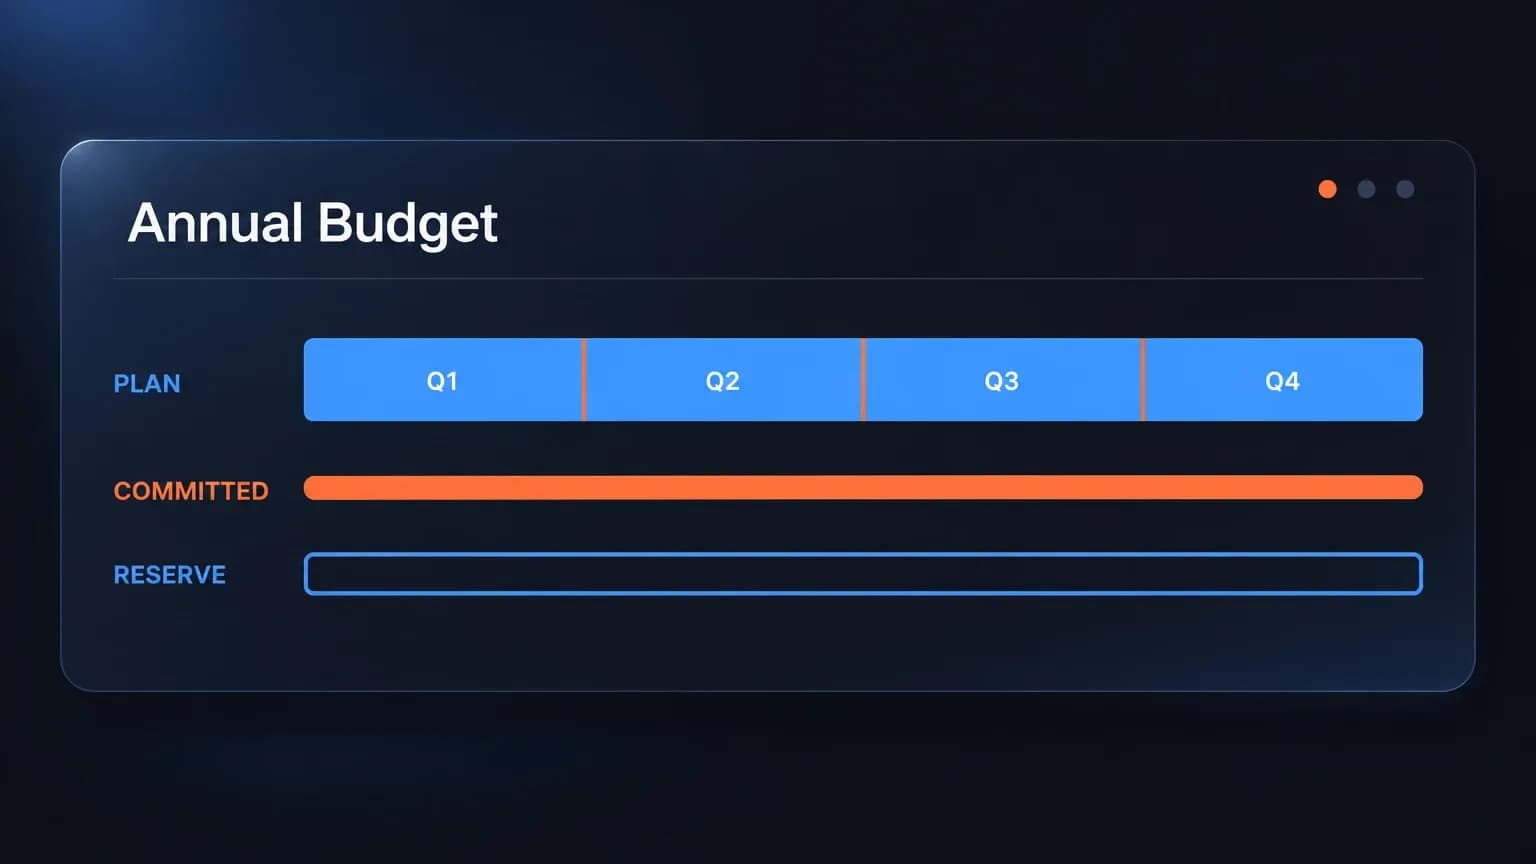
Your budget balances in January and is fiction by September, and nothing in the file says what would go first. Which line would you drop to find 12% before Friday?
That answer should already be in the document. Ask a search engine for a marketing budget template instead and you will have a spreadsheet in four seconds: generous with structure, and silent on what the money is for and who decides what goes first when it has to go.
What a Marketing Budget Is Actually Deciding
A budget is an allocation decision made under uncertainty, and the uncertainty is not symmetric. Money you hold back costs you opportunity. Money you commit costs you the ability to move, and in most companies the second cost lands harder.
The CMO Survey, fielded in January 2026 by Duke Fuqua with Deloitte and the AMA across 308 US marketing leaders, found that when profits fall short, 53.1% of executives cut expenses rather than invest in growth, up from 46.0% a year earlier. Marketing is the category cut 45.4% of the time, more often than any other function. A separate 2026 read from cmo.works puts marketing cuts inside roughly 45% of cost-reduction rounds, from 35% at small companies to 61% at the largest.
Your real risk is being the easiest line to take money out of, and that is structural rather than political. Reductions arrive in increments too small to argue about: WebsiteBuilderExpert's 2026 analysis found 23% of businesses cutting marketing by 1 to 5% and 29% cutting by 6 to 10%. Nobody writes a memo about a 7% reduction, which is exactly why your budget has to already know what it would drop.
The Mandatory Lines
Most downloadable templates get the categories right and the decisions wrong. They give you a row called Content and a row called Paid, and neither tells you anything you can act on in March.
Line | What it decides | How you size it |
|---|---|---|
Production, priced per asset | The cost of one unit of work, and how many units the plan assumes | Unit cost times planned count, per asset type, not per month |
Distribution, priced separately | What it costs to put each produced asset in front of people | Per channel, per asset, and kept out of the production row |
Contingency reserve | How much budget stays uncommitted, and who releases it | 5% to 15% of total budget, set by committed spend and volatility |
Committed tools and subscriptions | What is already spent before the year begins | Contract value, with a renewal date against every line |
Measurement | What makes a line revisable at all | A named metric per line, plus the cost of reading it |
That last line does quiet work. A line with no named metric cannot be revised, only renegotiated, and the marketing KPIs cluster is where a budget's metric set belongs.
Production cost, priced per asset
Every page in the head of this query treats content as one figure, and that single number hides the only decision inside it. Price production per asset instead: one long article, one ad creative variant, one landing page, one clip pulled from a webinar. A unit cost lets the plan state how many units it is buying, and a count is something you can reduce by a quarter when you need to find 12% without ending the programme.
This is also where build versus buy gets decided, and pricing per asset is what makes the two comparable. Our overview of content marketing services covers what that line buys when you take it outside, and what it still costs you internally to brief and approve.

Distribution, priced separately from production
An asset you made and never distributed is a sunk cost. Separate the two lines and an asymmetry appears: production is reducible and hard to restart, distribution is granular and reversible. You can pause the paid amplification of one asset for four weeks without cancelling anything, which makes distribution the first place to look for money.
There is a trap in reading that line. Analytic Partners, cited in 2026, estimates that around 30% of paid search is driven by brand and upper-funnel marketing, so a distribution channel can appear to be paying for demand it did not create. Read your paid line against the brand work above it, and treat the Google Ads reporting view as one input rather than the verdict.
The contingency line, sized and justified
This is the line the head of this query omits entirely, and the only one that has to be right before the year starts.
The Pedowitz Group, writing as a vendor source, puts a marketing budget's reserve at 5% to 15% depending on volatility, campaign complexity, growth goals and how much spend is already committed. Their point that matters more than the range: a reserve without approval rules, usage criteria and measurement requirements is not a reserve, it is an underspent line waiting to be absorbed. In their worked example, funds are released in stages, each with a KPI and a review date.
So size it from inputs rather than from an inherited percentage. Here is a marketing budget example for a team running a $300,000 annual budget.
Input | What this team reads | What it does to the size |
|---|---|---|
Committed spend | 58% already signed into tools, retainers and contracted media | Pushes up: the movable part is small, so the reserve has to cover the fixed part's surprises |
Volatility of the largest channel | Paid cost per acquisition swung 19% across the last two quarters | Pushes up: the wider the recent range, the more cover the reserve owes |
Campaign complexity | Three launches planned, two in new geographies | Pushes up: new markets break assumptions faster than known ones |
Growth goal gap | Target sits 30% above what the channel achieved last year | Pushes up, but only with a release rule |
Sized reserve | 5% floor, 15% ceiling, four inputs landing in the upper half | 9% of the annual budget, held uncommitted and unreleasable by default |
Two rules make that behave like a reserve instead of a cushion. Releases are staged, and each carries its own trigger, expected outcome and review date, so money moves into the channel whose threshold broke rather than into a new plan. And the size of the release decides who approves it: under 10% of a channel's budget, the person running the channel can release it; between 10% and 25%, the marketing lead and finance sign off; above 25%, both agree it in writing.
The rule that protects all of it is unglamorous. Reserve still unspent in December reduces next year's top-up, so say that out loud in January.
The Cut Order
Here is the part almost nobody writes down, and it decides whether your next reduction is a decision or an argument.
The market cuts in a predictable order, and the order is wrong. Funnel.io, writing in 2026, notes that brand marketing rarely produces immediate trackable conversions and is therefore often the first line item to go when budgets tighten, eroding the demand engine that feeds the channels left standing. The mechanism is measurable. Adobe and MMA Global's September 2025 study of 389 senior marketers found 57% of budget sitting behind performance channels, leaving 43% for everything else, against the at least 60% that Binet and Field's IPA Databank analysis recommends for consumer categories. That is a gap of roughly 17 percentage points, and cutting the brand side closes it in the wrong direction.
The cost is not theoretical. The Kantar ROI Analyzer, cited in 2026, reports that brands cutting brand spending by 10% see an average 14% revenue decline within 18 months, and the IPA and Binet and Field 2026 update puts brand building at about 60% of long-term growth against 40% for activation.
A better order, agreed before you need it. Work from the top and stop as soon as you have covered the number:

- Duplicate and redundant subscriptions. Two tools doing the same job cost you nothing in demand and everything in credibility when you defend them.
- Untested paid spend with no proven record. If it has never worked, it is a test budget, not a channel, and the test can end without a debate.
- Tactical and one-off spend with unmeasured return. Getadvize.ai's 2026 vendor-sourced list lands in the same place: underperforming or untested paid campaigns, redundant subscriptions, and tactical spend with weak returns.
- The least productive slice of distribution, never the whole channel. Pause the amplification of individual assets and keep the ability to restart inside the quarter.
- Brand and upper-funnel spend last, and only with a restoration date next to it.
Two rules sit on top. Every cut carries the same approval gate as a reserve release, so the amount decides who signs. And every cut is recorded as a change to one line with its exit condition, because a cut nobody recorded becomes permanent by accident.
Decide it in January, not in the meeting where you need it
The meeting where you need the cut order is the worst place to invent it, because the options presented will be the ones that are easiest to explain rather than the ones that cost least. I have watched a dozen of those meetings, and the tier that gets cut is almost never the one with the worst numbers. It is the one whose contribution the reporting cannot show. Decide while the year is theoretical, when nobody has a channel to defend yet.
Write yours down as an ordered list: the tier, the amount that would trigger it, and the approval level that cut needs, kept in the same file as the budget. That is the whole artefact, and it takes less time than the meeting it replaces.
Template vs Worksheet vs Model
Three things get called a marketing budget template, and only one decides anything.
A template is a blank structure: rows, columns, a total. A worksheet is that structure filled in, with formulas that subtract actuals from plan, so you can see whether you are on track. A model is a worksheet whose numbers come from stated assumptions about what each line buys, and a model is the only one of the three that can answer a question it was not asked, such as what happens to the whole when one channel's cost per acquisition moves 19%.
Most of what ranks for this query hands you the first, occasionally the second, and calls it a template. The format is not the constraint: a plain spreadsheet in Google Sheets or Excel will hold a model perfectly well. What a model needs is the plan it is modelling, which is why a budget works best as a companion to the content strategy template.
One distinction is worth keeping clean. A general accounting or personal budget template, the kind found in spreadsheet galleries, tracks categories of spending against a monthly total for a household or a profit and loss account. A marketing budget spreadsheet that never states what a row is buying is the same instrument with a marketing label on it.
Rebuilding It Quarterly
A budget built this way still needs the review loop that notices when a line has broken, and that loop is a different document. Its mechanics, one owner and one assumption and one review trigger per line, with a worked quarter where a line gets re-cut, are covered in our marketing plan template. Read it as a marketing spend plan rather than as a spreadsheet that gets filed once a year. Everything above decides an amount and its destination, once, in January. The plan template notices when the decision stopped being true.
Conclusion
The January version of your budget will be approved, distributed and then left alone, which is fine, because what keeps it true is not more review meetings. Do the reserve first: size it from committed spend and volatility, give it staged releases and an approval gate, and state in writing that unspent reserve reduces next year's top-up. Then write the cut order directly underneath it, in the same file. When the September conversation arrives, you will be reading a decision instead of inventing one.
Frequently Asked Questions
How do you build a marketing budget?
Start from the total you can spend, then fill five lines before you fill any channel: production priced per asset, distribution priced separately, a contingency reserve, committed tools and subscriptions, and a named metric against each line. Then allocate across channels, because an allocation made before the reserve exists will consume the reserve. Once the lines are set, write the cut order into the same file, so the next reduction is a decision you already made rather than a meeting you have to survive.
What percentage of revenue should go to marketing?
There is no single number, and the two most-cited surveys disagree. The CMO Survey in January 2026 puts marketing at 9.0% of company revenue and 9.6% of overall budgets, but its median is 5% against a mean of 8.96%, which tells you a small group of very heavy spenders drags the average up. A second survey of 401 CMOs, skewing above $1 billion in revenue, reads budgets as effectively flat and reports 56% of CMOs saying they lack the budget to deliver their 2026 strategy. The two sample different populations and cannot be blended. For planning, roughly 7% to 10% of revenue is defensible, with B2B services near 10.1% and B2B product near 7.0%.
Should a marketing budget include a contingency?
Yes, and leaving it out is the most expensive omission in a typical plan. Vendor guidance puts the reserve at 5% to 15% of total budget, sized from committed spend, recent volatility, campaign complexity and how far the growth target sits above last year's result. What separates a real reserve from a wish is what happens after it is sized: releases are staged, each carries its own trigger and review date, and the size of the release determines who approves it.

Put the cut order somewhere it can be checked
A budget decision is only as good as the spend it is measured against. Allable connects your campaigns and your analytics in one workspace, so a line can be read against live numbers instead of a figure someone remembered, and the channel whose threshold broke is the one your money moves toward.