Your content marketing ROI has never been challenged on the number itself. It gets challenged on the window, the model and what you counted as cost. Do you know which of those you actually chose, and which one a tool chose for you?
Which window was your content marketing ROI calculated on, and who chose it? You can probably answer the first half. The second half is where it stops being defensible. Three settings decide that number, and two were never a decision anybody made.
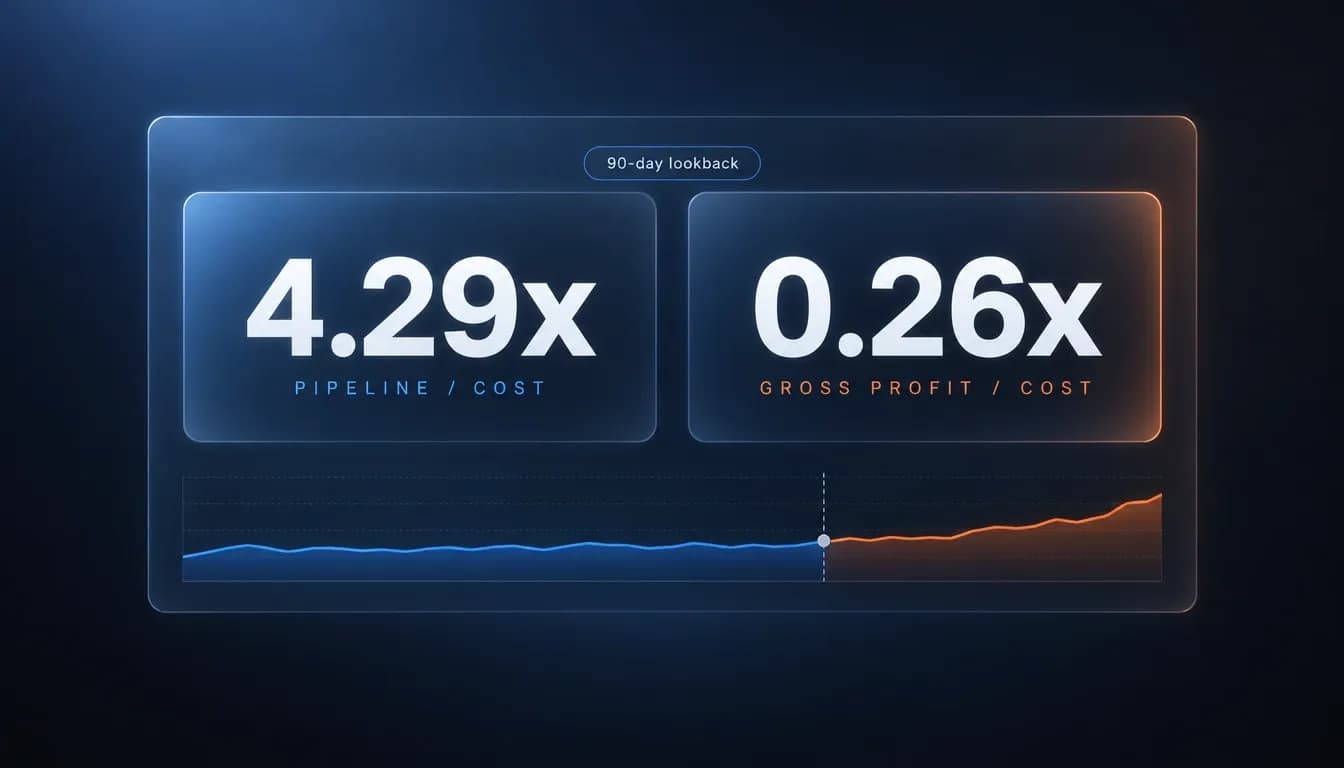
The attribution window came with the analytics tool, already set, before your first campaign ran. The cost line leaves out the hours your own team spent making the thing. The model, at least, was a real choice, even if nobody wrote down the reason. The first two are why the same quarter can report 4.29 dollars of pipeline per dollar spent or 26 cents of gross profit on that dollar, with nothing about the work changing between the figures. The person who gets to choose which one goes in the deck wins the meeting, and that is rarely the person who did the work.
I have watched this play out in client budget meetings for years, and the number with the better argument loses to the number with the louder sponsor almost every time. What wins is being able to say, without hedging, out loud, which window, which model and which cost lines produced it. That is the whole skill behind a defensible content marketing return on investment, and it is learnable.
Why your content marketing ROI collapses under one question
The question that ends the discussion is rarely the one you prepared for. Someone asks over what window the number was calculated, and the answer is a default nobody in the room chose. Leave that unanswered and your content marketing ROI stops being a measurement and becomes an opinion with a decimal point.
Google Analytics 4 is a good place to see how little of this was ever chosen. It credits a key event to a click up to 90 days back unless you change it, and it retains the underlying event data for 2 or 14 months depending on your property configuration (Google Analytics Help, read November 2026). One is a scoring default, the other a storage limit, and both shape the number you report.
The field does not help much here. On the live read behind this page (November 11, 2026), results still carry pieces dated 2014 and 2019, which tells you the topic has not been maintained rather than that it has been solved. The strongest recent guide on the topic (Mindstamp, October 1, 2026) states the content ROI formula and the full cost list correctly, then stops at the point where a real quarter produces a real answer that is not the one you wanted.
Assume you can already compute the number. The harder work is deciding what a weak one means, and which kind of problem it is telling you about. If you need the wider frame first, the measurement model this sits inside is covered in marketing measurement.
A conservative content marketing ROI model with a lookback you can defend

Pick a window and put it in writing before any arithmetic. Everything below uses a 90-day lookback window from first content touch to closed won. If your sales cycle runs longer than a quarter, use 180 days instead, and say so. One rule matters more than the number you choose: you cannot change the window mid-year and still compare the two halves of that year.
The model has three inputs.
- Content-attributed pipeline. Deals where at least one content URL appears in the path, valued at deal amount, in the quarter the deal closed.
- Pipeline-to-revenue conversion. The share of that pipeline that became closed won revenue.
- Gross margin. The share of that revenue left after delivery cost.
Now the arithmetic, with figures you should replace with your own. A program creates $412,000 of content-attributed pipeline in four quarters. At a 22% pipeline-to-revenue rate that is $90,640 of revenue. At a 28% gross margin, $25,379 of gross profit. Content cost $96,000 to produce. Two ratios come out of the same data:
What you divide | Result | What it says |
|---|---|---|
Pipeline over cost | 4.29x | What the program influenced |
Gross profit over cost | 0.26x | What the business kept |
Both are true. Only one of them travels upward without a challenge, which is exactly why it is the one in most decks. If a colleague asks how to measure content marketing ROI honestly, the answer is the second row, with the first row attached as context.
Run the arithmetic twice before you present it. Move the conversion rate from 22% to 18% and the gross profit ratio falls to 0.22x. Move the gross margin from 28% to 35% and it climbs to 0.33x. Neither input is under your control in the quarter you are reporting, which is why both belong in the footnote. A number with its two weakest inputs printed beside it is much harder to dismiss than a single line item, and the person who printed them looks like they understand their own model.
Two things keep this model alive in a finance review. It never counts avoided ad spend as a return, and it never presents traffic value as revenue. A page that would have cost you $4,000 in paid clicks to reach the same audience saved you money, and saving money is not the same as earning it. That substitution is where a content ROI figure stops measuring a return and starts reporting a cost saving nobody asked for.
The window needs defending too, and the defensive argument has got stronger. Dreamdata's 2026 benchmark, covering 66 million sessions and 3.5 million customer journeys, puts the average B2B buying journey at 88 touchpoints across 4 channels and 10 stakeholders, up from 76, 3.7 and 6.8 in the prior edition (Dreamdata LinkedIn Ads Benchmarks Report 2026, released March 10, 2026). A 90-day window cannot see a journey of that length. That is an argument for extending the window and saying so, not for abandoning the model.
The calculation leans on three assumptions. Write them on the same page as the number:
- Which URLs count as content. Editorial pages and guides, yes. Product and pricing pages, no.
- What counts as a touch. A session that lasted, not a pageview that bounced.
- Which deals are in scope. New business only. Renewals and expansions are a different number.
The denominator: what your content actually costs
Content ROI debates are rarely arguments about return. They are arguments about a cost base that was never counted. Here is the same $96,000 built line by line, for a program running on freelancers with a small internal team.
Cost line | Annual |
|---|---|
Freelance writing and editing | $52,000 |
Tooling share (SEO, analytics, CMS) | $14,400 |
Design and illustration | $9,600 |
Paid distribution and amplification | $12,000 |
Internal hours | $8,000 |
Internal hours is the line that decides whether the ratio is honest, and it is also the one nobody has. Mindstamp's advice, to log hours for a full quarter before calculating, is correct and useless in the meeting that happens next Tuesday.
So count people instead of minutes. Take last quarter's editorial calendar, list every name that touched a published piece, give each one a loaded hourly rate from payroll, then apply a stated default of four internal hours per published piece across briefing, edit and review. At 40 pieces and a $50 loaded rate, that is the $8,000 in the table. Write the assumption at the bottom of the page. A visible assumption can be argued with, and a missing one just makes the number wrong.
The market data suggests why this line is so often absent. Asked where they will increase investment during 2026, B2B marketers put owned media at 32% and human resources, meaning salaries, training and development, at 9%, last of eleven options (Content Marketing Institute, B2B Content and Marketing Trends for 2026). Teams are funding the assets and not the people who make them, then reporting a denominator that was never going to include them.
That asymmetry is the sharpest version of the argument. If you want a defensible ratio, you are asking for more of a line item that ranks last.
What each attribution model hides about a content program
You will not get a perfect model, and the choice between them is a longer subject, set out in attribution model choice. What matters here is what each one does to a content program specifically.
Last click credits the final page before conversion. Content is structurally first and rarely last, so last click undercounts content by design and rewards whatever page sits at the end of the funnel.
First touch credits discovery. That flatters a brand video and buries the comparison page that actually closed the deal.
Linear splits credit evenly across touches. Nothing looks responsible. Every asset looks mildly useful, and nobody can be held to a number.
Name the model on the same line as the result. A ratio with no model named cannot be checked by anyone, including the person who built it.
When the number is bad: three diagnoses and the response to each

Nothing in the four guides I read closely for this piece triages a bad result into its possible causes, which is odd given how often the result is bad. A weak content marketing ROI figure can fail in more than one way, and each way needs a different response. Pick the wrong one and you spend a quarter fixing something that was not broken.
Answer one question before you touch anything else: does the piece appear in any path that closed, anywhere in the raw data? That single answer splits a bad asset from a bad measurement, and the two need opposite responses. Run the checks in the order below, because the cheapest one comes first and it needs data you already hold.
Diagnosis 1: the measurement is wrong
The program is fine and the number is not. Look for a window shorter than the journey, a model that credits only last click, or a cost base missing internal hours you never booked.
The test takes an afternoon. Recompute the same quarter on a 180-day window and see how much pipeline appears. Any deal that opened late last autumn and closed this spring sat outside the first window and lands inside the second, so the figure can only move up. Then check whether your worst-performing pieces show up in assisted paths at all in the raw event data. If they do, you have been reporting a floor as if it were a ceiling.
Fix the measurement before you touch the content. Change nothing else that quarter. Every brief in the queue stays where it is, because you do not yet know which ones are underperforming.
Diagnosis 2: the asset is wrong
It gets read, it ranks, and it moves nobody. Watch for strong consumption with no presence in assisted paths, or rankings on queries that nobody buys from.
The honest failure, and the easiest to fix. The topic worked and the page did not. Usually the offer at the end is wrong, or the page answers a question with no commercial consequence, or it targets a keyword whose searchers want a definition rather than a supplier.
Rewrite the conversion path first and retire the page second. If a rewrite does nothing in 60 days, redirect the URL to the closest page that does convert and take the lesson into the next brief. Reallocating production capacity is a decision this diagnosis earns; cutting the program is not.
Diagnosis 3: the spend is wrong
The piece is read, it appears in buyer paths, and it still cannot pay for itself. The giveaway is a cost per engaged session higher than a closed deal can carry, and it shows up at the format level rather than the page level.
A format problem, and it is where the portfolio decisions get made. A 2,000 word custom guide, a produced video and a comparison table do not cost the same to make or return the same thing. Until all three sit on one line with a common denominator, nobody can say which one is subsidizing the others. Put a video and a written guide side by side and the arithmetic tends to surprise the person who commissioned both. The format with the worse ratio is usually the one with the most visible internal sponsor.
The move is to change the format before you cancel the topic. A subject that failed as original research may work as a comparison page or as a repurposed series of shorter pieces, which is the cheaper route and covered in content repurposing. If the cheaper format also fails, you have a real answer: stop commissioning it.
The fourth thing that can break your model
There is a cause outside all three, and it is the one nobody has budgeted for. The click supply underneath every content ROI method is contracting.
Pew Research Center measured it directly: across 900 US adults and 68,879 searches, a result was clicked in 8% of visits when an AI summary appeared, against 15% when it did not (Pew Research Center, July 22, 2025). Traffic value, engaged sessions and last click attribution all assume a reader arrives on a page. Fewer of them do, and the change is not in your content or your model.
Treat it as a re-baseline. When you compare this year to last, note whether AI summaries appeared on your priority queries in both periods. If they did not, part of your decline is a measurement artifact of a market change.
The triage on a quarter with the usual problems
A worked illustration with assumed figures, because the order matters more than the individual answers. Imagine a team reporting content at 0.4x gross profit over cost. That reads as a failing program, and nobody wants to be the person defending it at budget time.
The first check finds a 90-day window on a sales cycle that runs 140 days. Re-cut on 180 days and the same quarter returns 0.9x, because most of the pipeline was there the whole time, outside the window. Fix the window and rebuild the baseline. Do not change a single brief.
The second check takes the three weakest pieces and asks whether they appear in any closed path. In this illustration two do, which means they were never the problem. The third appears nowhere and still draws 4,000 sessions a month from a query starting with "what is". That is diagnosis two. Rewrite its ending around a decision the reader has to make, or retire it.
The third check looks at format. The two videos in the mix cost several times a written guide per finished asset and land at a fraction of its ratio on the same window. That is diagnosis three, and it calls for a format decision rather than a content decision: fewer videos, more comparison pages, same total budget.
Every check lands somewhere, and none of them lands on "content does not work". A program can contain a bad window, two weak pages and an overpriced video at the same time, and each one needs a different response. What you are not allowed to conclude from a bad quarter is that the whole channel is the problem.
What to report monthly: one page, five rows
One page is enough. Five rows, one of which answers the question your budget holder will actually ask.
Row | Definition | Cadence |
|---|---|---|
Content-attributed pipeline | Deals with a content URL in the path, 90-day lookback, model named | Monthly |
Loaded content cost | Actual spend against plan, internal hours included | Monthly |
Pipeline ratio and gross profit ratio | Both, on the same line, as in the model above | Monthly |
Engaged sessions per asset | Sessions past the intro, per published URL | Monthly |
Format cost per engaged session | Rolled up by format, not by piece | Quarterly |
A few rules keep the table honest.
- Every comparison states its base. If the base moved, the same line says so.
- Any new row arrives with the decision it would change. No decision, no row.
- The model and the window are printed at the top, not in an appendix. If they changed, that is the first thing you say.
The reporting discipline itself is a separate skill, and the KPIs you send upward have their own hierarchy in marketing KPIs. If your organization needs the shape of the monthly document rather than the content, start from a marketing report template and cut it down to these five rows.
Frequently Asked Questions
How do you measure content marketing ROI without a clean attribution model?
You measure a range and you name its parts. Use content-attributed pipeline as the return, with a stated window and a named model, and report both the pipeline ratio and the gross profit ratio. You will not get a single true figure on a considered purchase. Two defensible ones beat one that cannot be checked.
What lookback window should a content ROI formula use?
90 days if your sales cycle closes inside a quarter, 180 if it does not. Write it down, keep it for the full year, and never change it mid comparison. Longer windows find more pipeline, so a change upward will look like performance and a change downward will look like a collapse. Both are artifacts of the setting, not of the work.
Can content marketing ROI be negative?
Yes, and it happens more often than the field admits. When you count the internal hours and the paid distribution, a program producing pipeline at a low close rate can return less in gross profit than it costs. No reliable public benchmark for content ROI exists to check yourself against, so your own prior quarter is the only fair comparison. A negative figure is a finding about the format mix, not an argument that content does not work.
How long does content take to show a return?
Longer than the window you are probably using, and the gap is widening. The average B2B buying journey now runs 88 touchpoints across 4 channels (Dreamdata, 2026), so a piece published this quarter may influence deals closing in the next two. Judge a new asset on consumption and assisted appearances for its first 90 days, then on pipeline after that.

Put the number in front of your budget holder
Connect the analytics and search data you already own, build the five rows from live numbers instead of last quarter's export, and let the first version be rough. Content marketing ROI models fail on the things nobody wrote down, so write the window, the model and the cost base where someone can challenge them. The first version will be challenged, and that is what you want. A model somebody can argue with is a model somebody can approve.